This tutorial shows how to plot data that was generated in ToonTalk in Excel or similar spreadsheet and save the graph as an image.
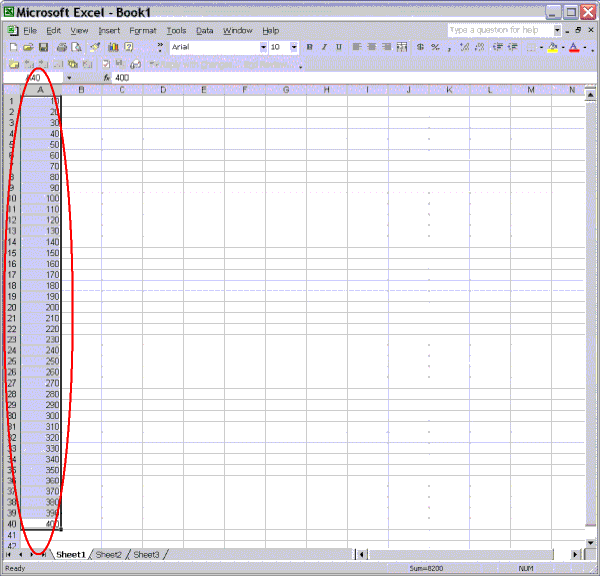
Step 1. Paste the data you want to plot into Excel, and then select it.

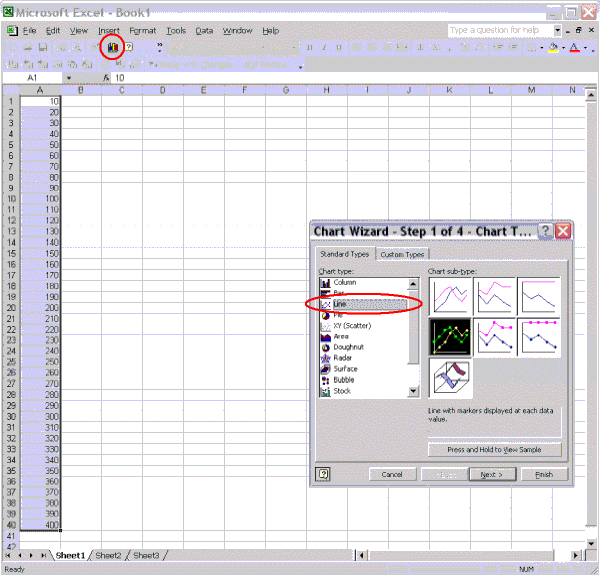
Step 2. Click the Chart Wizard icon. Then select Line as chart type.

Step 3. Click Next and fill in X axis and Y axis fields.

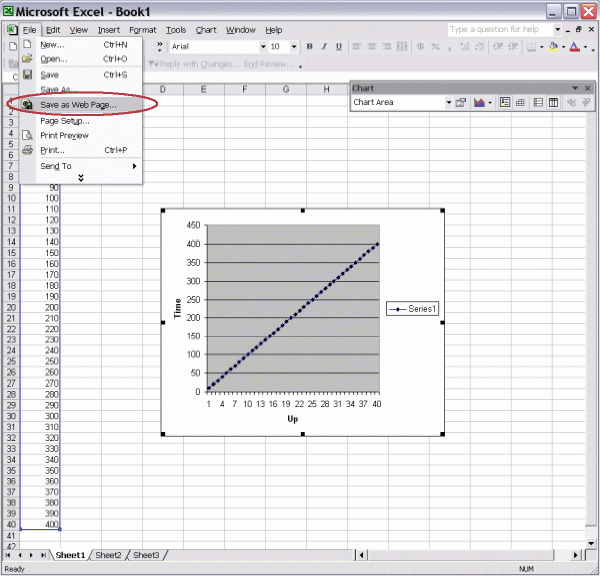
Step 4. Click Finish. You now have your chart. You need to save it as an image file so it can be inserted into your webreport. Select Save as Web Page, then choose a sensible place on your computer to save it.

