Stream bar graph
What does it do?
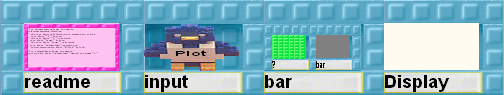
It plots a bar graph of the elements of a stream.
How do I use it?
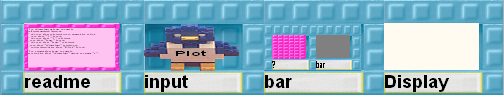
Build a bar with a label for each unique element contained in the stream.
Add all bars to the display.
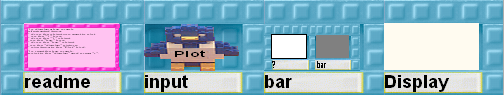
To build a bar, drop the element on top of the "?" box. Pull the "bar" out of
its box. Drop the "?" element on the "bar" picture. Now you have a bar with a
label indicating the element it is associated with.
How does it work?
Give objects to the input bird or connect it to the output of a robot by
giving it a nest into a box. To reset the bar graph, press "r" while pointing
at the "display" picture.
This tool is based on the Graphing tool.
What can I use it for?
Pictures' bar graph:
Numbers' bar graph:
Text's bar graph: